FIGURE 7:
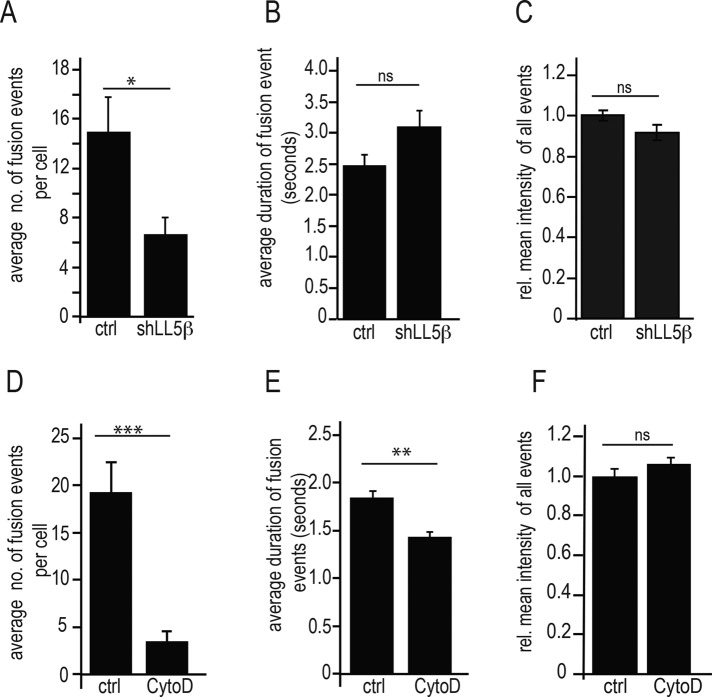
LL5β knockdown and CytoD treatment differentially affect frequency, duration, and GFP fluorescence intensity of AChR vesicle fusions. All methods and parameters as defined in Figure 6. Bars give means ± SE. (A–C) LL5β-knockdown myotubes. Note the reduction of fusion numbers during 30-s observation period upon LL5β knockdown without changes in duration and intensity of fusion events. The relative number of double fusions at the same sites was not affected (see text). N = 12 cells for control and 14 for cells for LL5β-knockdown myotubes. Means ± SE. *p < 0.05. (D–F) CytoD-treated myotubes. Note stronger reduction of fusion numbers during 30-s observation period upon CytoD treatment, with significant reduction in duration but not intensity of fusion events. Means ± SE. N = 14 cells for control and 14 cells for CytoD-treated myotubes. **p < 0.001, ***p < 0.0001.

