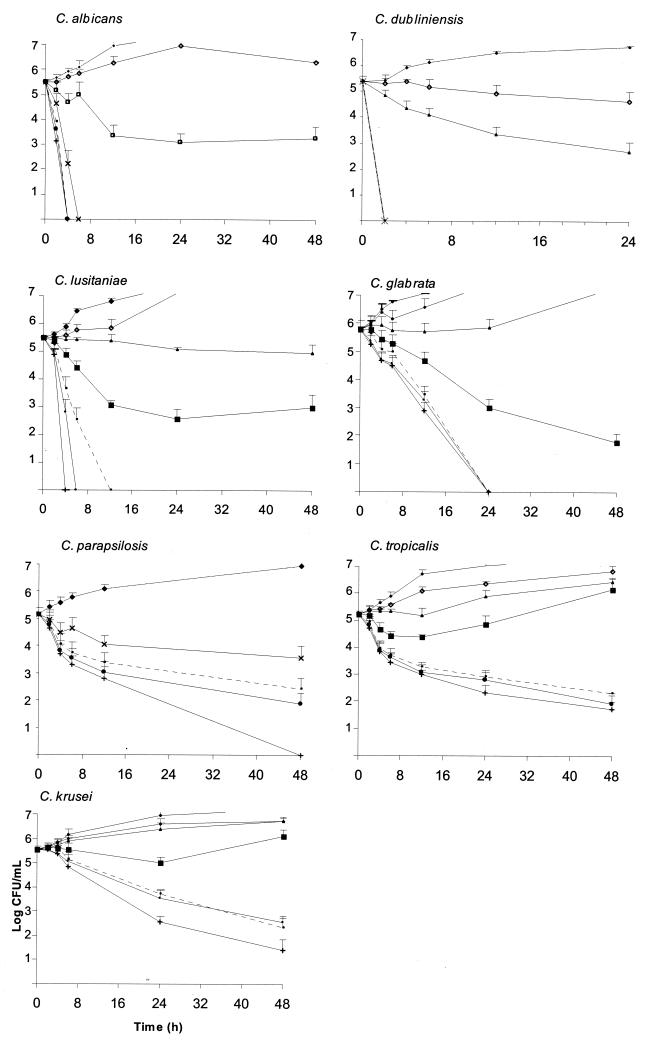
FIG. 1.
Representative time-kill plots for Candida species following exposure to amphotericin B. Average datum points and standard deviations are provided for six C. albicans, three C. dubliniensis, five C. parapsilosis, five C. krusei, four C. glabrata, three C. tropicalis, and three C. lusitaniae strains at the following concentrations: no drug (control; ♦), 0.03 μg/ml (⋄), 0.12 μg/ml (▴), 0.25 μg/ml (□), 0.5 μg/ml (▪), 1 μg/ml (×), 2 μg/ml (dashed line), 8 μg/ml (•), and 32 μg/ml (+). As the curves for some concentrations overlap, see Fig. 2 for a better visualization of the effects of the different concentrations.

