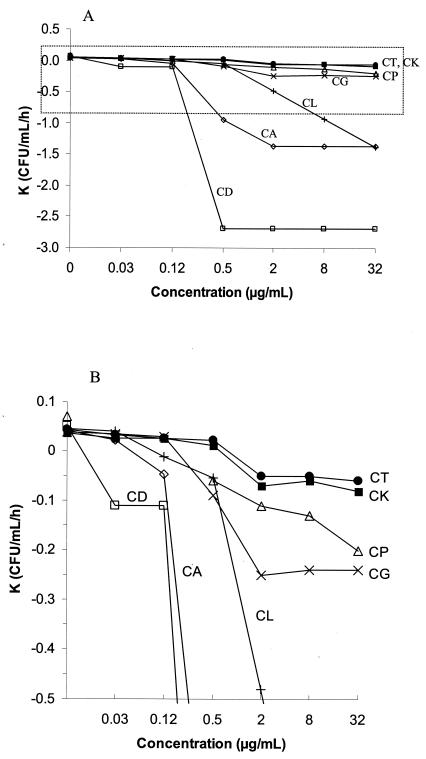
FIG. 2.
(A) Relationship of amphotericin B concentrations and K values calculated from the regression line of survival times for C. dubliniensis (CD), C. albicans (CA), C. lusitaniae (CL), C. parapsilosis (CP), C. glabrata (CG), C. krusei (CK), and C. tropicalis (CT). (B) Amplification of the area marked with dotted lines in panel A.

