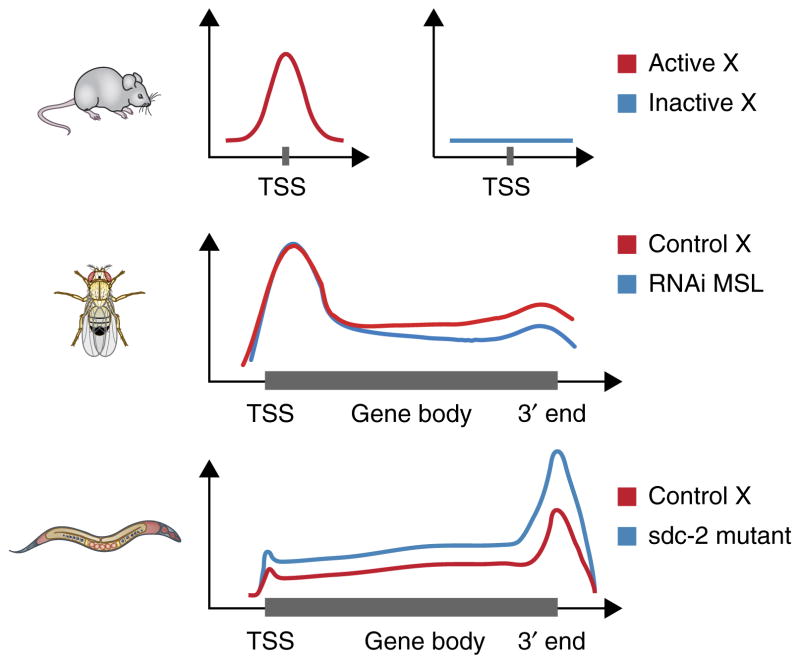
Figure 2.
Metagene visualization of dosage compensation. Dosage-compensation mechanisms have a small effect in magnitude (approximately two-fold) but are observed over a large number of genes (entire chromosomes). For these characteristics, genome-wide experimental methods are particularly useful, because visualizing the average effect over many genes is a commonly adopted solution. Metagene profiles are average summaries of a quantitative score derived from genomic data, plotted against relative coordinates over gene loci. Metagene profiles can be plotted relative to a single position (top), for example, around the transcription start site (TSS), or relative to the gene body (middle and bottom), with scaling of the distance between the TSS and 3′ end for multiple genes (Box 3). In mammals (top), analysis of Pol II occupancy in the active (Xa) and the inactive (Xi) shows the lack of Pol II recruitment at the TSS of genes on the inactive X25. In male fruitflies (middle), an average relative increase in elongating Pol II density on X versus autosomes has been reported, and this effect is lost after RNA-interference (RNAi) knockdown of key components of the dosage-compensation complex (MSL)35. In hermaphrodite nematodes (bottom), mutants for the sdc-2 component of the dosage-compensation complex shows approximately double density in Pol II recruited to X-linked genes5.

