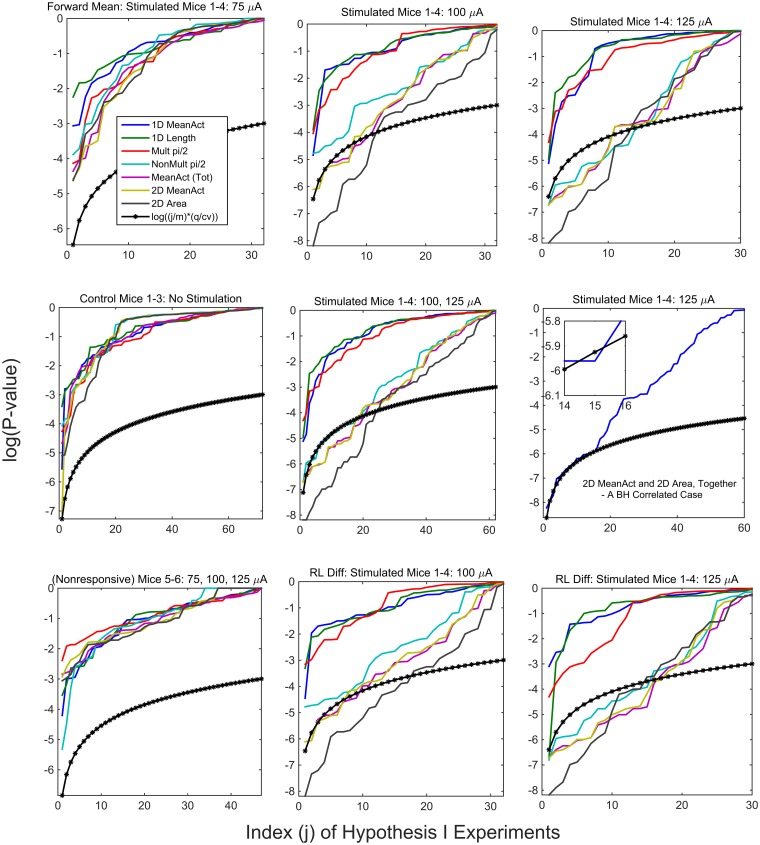
Fig 7. False Discovery Rate Analysis for Hypothesis I: Plots of the P-values for null hypotheses, for the Stimulated Mice 1–4, the control Mice 1–3 and the Nonresponsive Mice 5–6.
Two conclusions: The three 1-dimensional statistics never go below the threshold function in any of the cases; in the combined 100, 125 μA plot for the Stimulated Mice 1–4 (middle plot of Row 2), and the four 2-dimensional statistics each have between 20 and 25 significant tests out of the combined 62.

