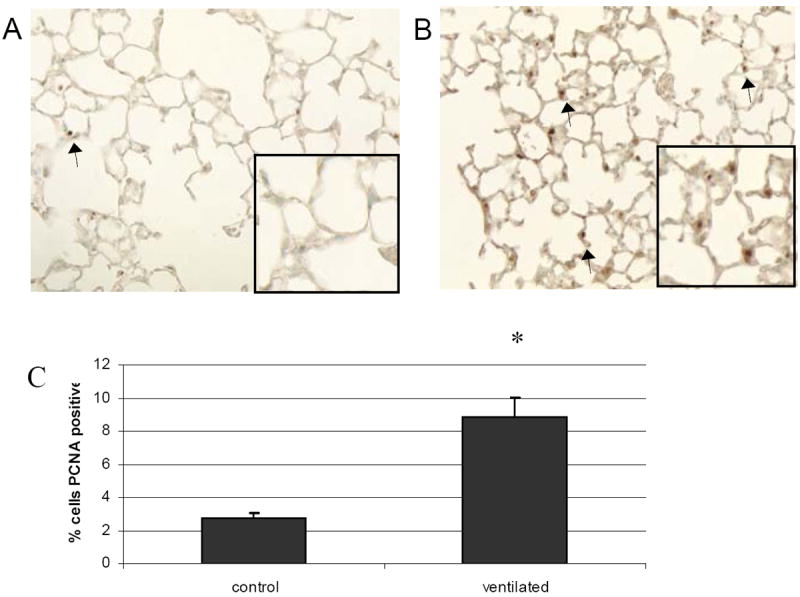
Figure 5.

PCNA staining of A: nonventilated and B: ventilated mice. C: Quantification of IHC. Ventilated mice have a 3 fold increase in PCNA staining compared to nonventilated controls. Arrows note representative positively stained cells. 20x magnification. Values represent mean ± SEM (*p<0.05). N=6 per condition.
