
Figure 4.
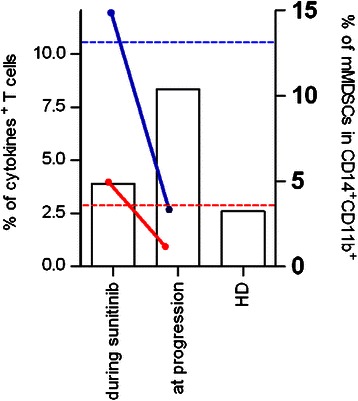
Frequency of circulating mMDSCs and T cell function during sunitinib treatment. Histograms show the frequencies of CD14+HLADRneg/low (mMDSCs) in live gated CD14+CD11b+ cells of patient’s PBMCs. Average level of mMDSC frequency of healthy donors (HD) is reported. Patient’s PBMCs were assayed for IFN-γ (red line) and IL-2 (blue line) production in response to overnight activation with anti-CD3/CD28-coated beads. Dotted horizontal lines (IFN-γ (red) and IL-2 (blue)) indicate the average level of cytokine-producing T cells in HD.