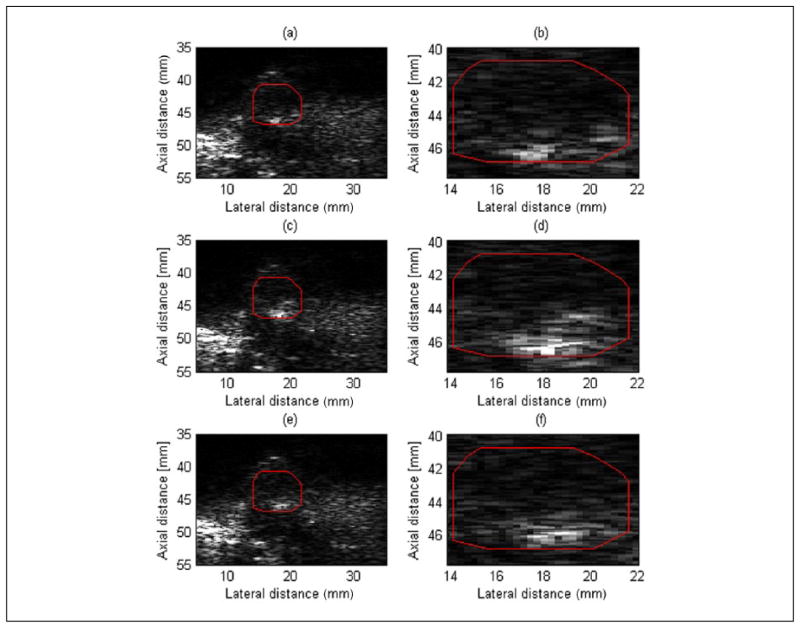
Figure 5.
B-mode images at different times (corresponds to three different time points shown in Figure 4) during the HIFU treatment of R3. The red square in (a), (b), and (c) denotes the location of the ROI, and in (b), (d), and (f) refers to the magnified view of the corresponding ROI. HIFU = high-intensity focused ultrasound; ROI = region of interest.

