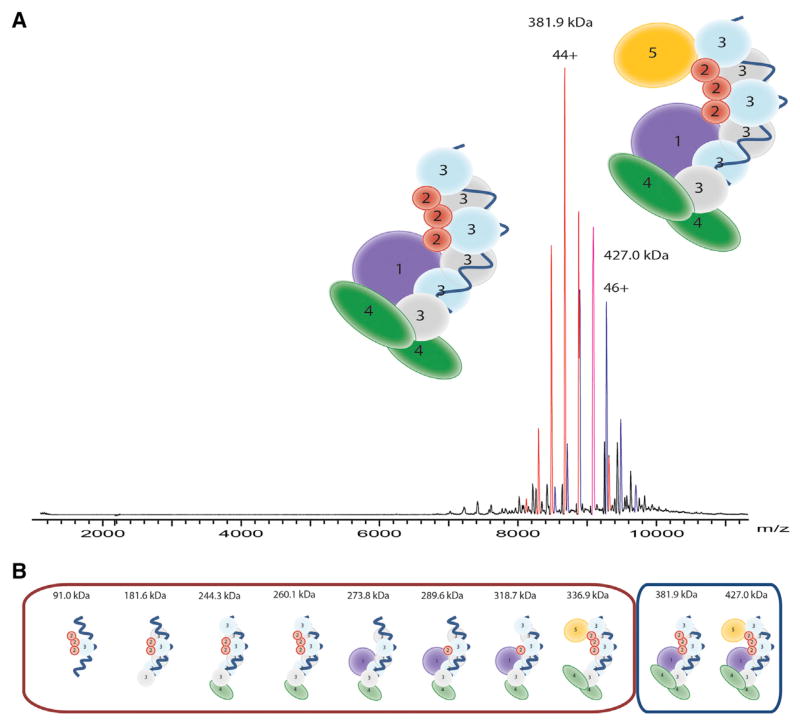
Figure 4. Subunit Composition of TtCsm.
(A) Native nanoelectrospray ionization mass spectrum of the native TtCsm complex. Two main well-resolved charge state distributions are present at high m/z values, corresponding to complexes of 427 kDa (blue) and 382 kDa (red).
(B) TtCsm (sub)complexes analyzed by native mass spectrometry. The subcomplexes were formed after in-solution dissociation with 30% DMSO v/v or 175 mM ammonium acetate acidified with acetic acid (pH 3.6–4). More in-depth calculations of the different (sub)complexes can be found in Table S1 and Table S2.

