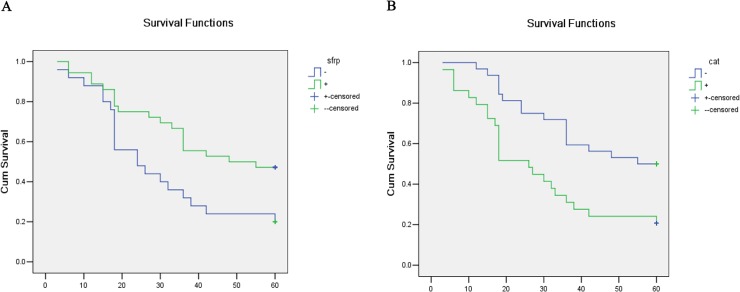
Fig 1. Kaplan-Meier curves of the relationship of SFRP1 and β-catenin expression with overall survival in PCa patients.
A, The relationship of SFRP1 expression with overall survival in patients with PCa (P = 0.016). B, The relationship of β-catenin expression with overall survival in patients with PCa (P = 0.004).

