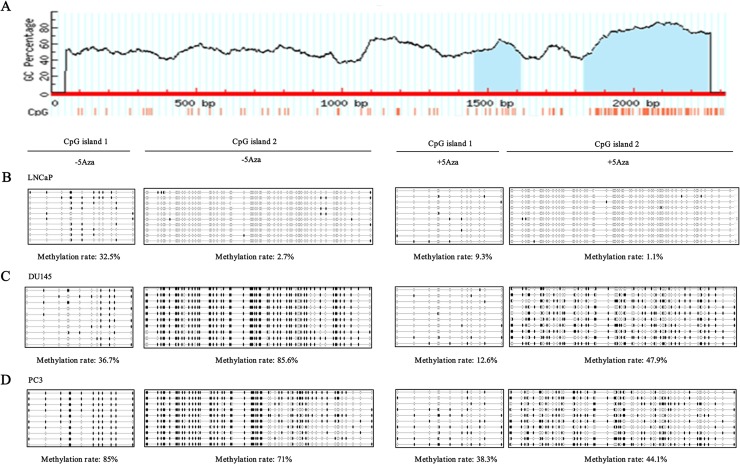
Fig 4. Changes of SFRP-1 promoter methylation in LNCaP, DU145 and PC3 cells.
A, Schematic diagram of the SFRP-1 promoter region (blue-colored regions: CpG islands). CpG island 1 was from 1454 bp to 1613 bp. CpG island 2 was from 1831 bp to 2257 bp. B-D, Methylation of CpG island 1 (left panel) and CpG island 2 (right panel) in LNCaP, DU145 and PC3 cells, respectively treated with or without 5Aza. Each circle represents a methylated (black) or unmethylated (white) CpG dinucleotide. Every row represents a different clone.

