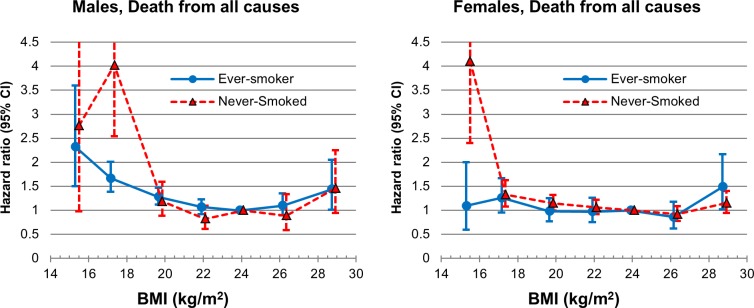
Fig 2. Age-adjusted hazard ratio for all-cause mortality according to smoking status among the Korean elderly from 1985–2008 by 7 categories of body mass index (BMI) (<16, 16–18.4, 18.5–20.9, 21–22.9, 23–24.9 [Reference], 25–27.4, ≥27.5).

The midpoint of each BMI category was used as a representative value for each category, except for both ends of BMI categories, in which the median was used as a representative.
