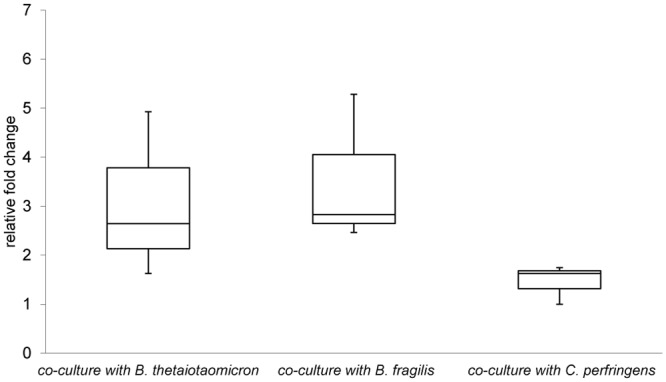
Fig 4. The expression of escU determined by qPCR in various conditions.

The figure shows relative expression of escU when EHEC NIPH-11060424 is grown in co-culture with B. thetaiotaomicron, B. fragilis and C. perfringens compared to growth in pure culture. Boxes show the upper (75%) and the lower (25%) percentiles of the data. Whiskers indicate the highest and the lowest numbers.
