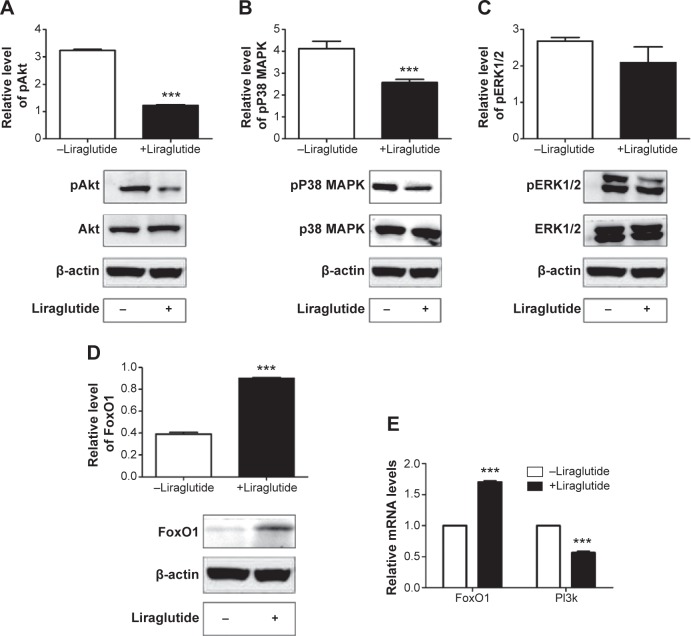
Figure 4.
Effects of liraglutide on Akt signaling pathway.
Notes: Western blot showing (A) pAkt, Akt, (B) pP38 MAPK, P38 MAPK, (C) pERK1/2, ERK1/2, and (D) FoxO1 in visceral adipose tissue of liraglutide-treated and control group. Real-time PCR showing relative mRNA levels of FoxO1 and PI3K (E) in visceral adipose tissue of liraglutide-treated and control group. The data shown represent the means ± SD. ***P<0.0001 versus control.
Abbreviations: PCR, polymerase chain reaction; mRNA, messenger ribonucleic acid; SD, standard deviation.

