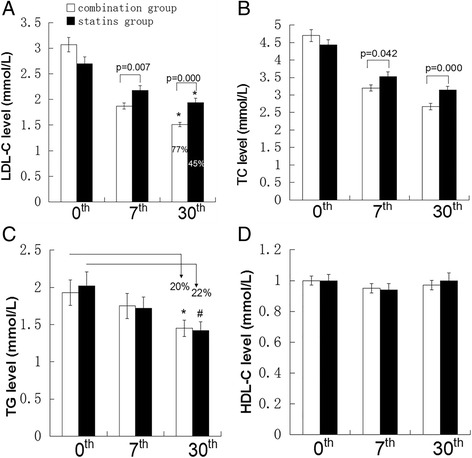
Figure 1.

Plasma lipids levels in both groups during follow-up. ACS patients with T2DM divided into two groups, the combination group who received EZ 10 mg/d with standard dose of statins (n=44) and statins group who received standard dose of statins (n=40). Plasma lipids levels were tested at baseline, 7th day and 30th day after treatment. (A) LDL-C levels and control rate of LDL-C. *Indicate the percentage control rate of LDL-C level, P=0.002. (B, C, D) TC, TG, HDL-C levels. *p=0.000 versus TG level at baseline in combination group.#p=0.000 versus TG level at baseline in statins group. Data are shown as mean ± SE. Independent t test was to compare the significant difference of treatment groups. Data expressed as as mean ± SE.
