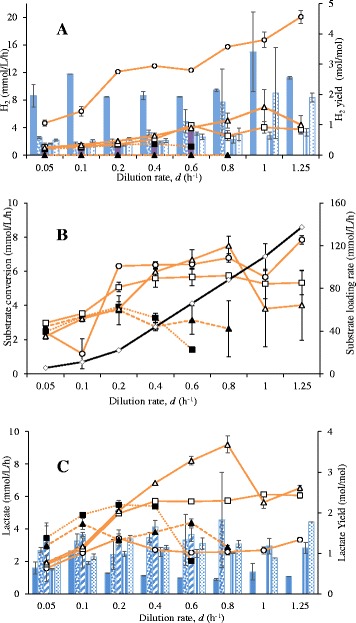
Figure 3.

Results of the continuous cultures of C. saccharolyticus and C. owensensis performed in the up-flow anaerobic (UA) reactors. (A) Q H2, line graph (mmol · L−1 · h−1) and H2 yield, bar graph (mol · mol−1); (B) substrate conversion rate and substrate loading rate (mmol · L−1 · h−1); and (C) lactate productivity (mmol · L−1 · h−1), line graph and, lactate yield (mol · mol−1), bar graph. Case E (open circles, filled bar); Case F (open squares, open bar); Case G (open triangles, bar with vertical lines); Case H (filled triangles, dotted bar); and Case I (filled squares, bar with horizontal lines). Substrate loading rate, solid line with open squares.
