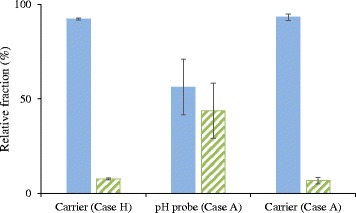
Figure 7.

Fraction of C. saccharolyticus and C. owensensis in biofilm samples (Case A and H). C. owensensis (filled, blue) and C. saccharolyticus (horizontal lines, green), values on X-axis represent the source of the biofilm sample with respect to reactor system and the carrier.
