Figure 2.

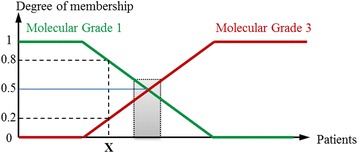
Membership degree of a patient X to both molecular grade 1(green) and grade 3 (red) classes. The gray rectangle, for membership values around 0.5, corresponds to an uncertainty zone where gene expression values are intermediate.

Membership degree of a patient X to both molecular grade 1(green) and grade 3 (red) classes. The gray rectangle, for membership values around 0.5, corresponds to an uncertainty zone where gene expression values are intermediate.