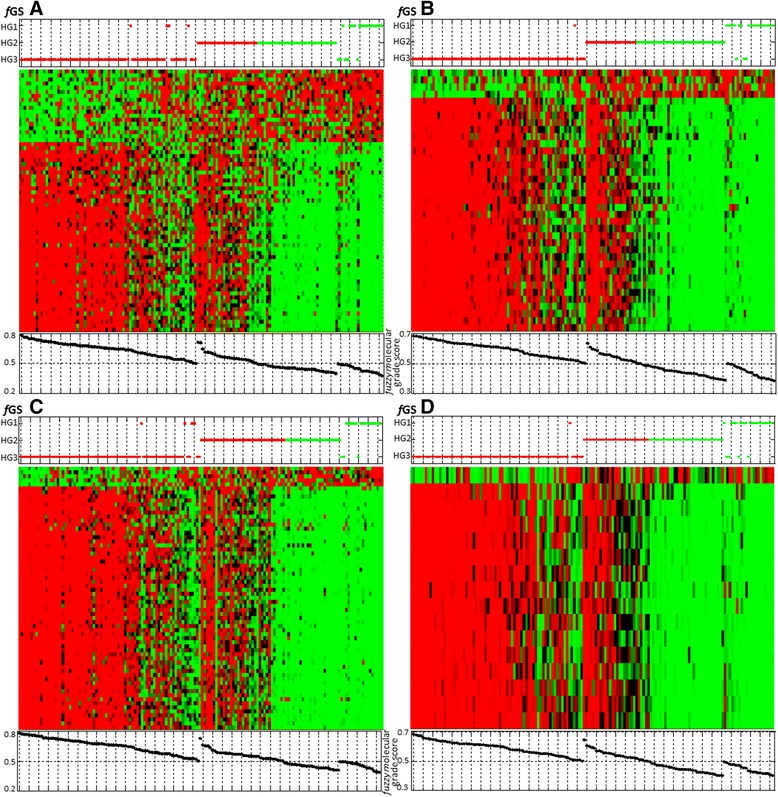
Figure 6.

Heat maps for fuzzy gene signatures A, B, C and D in the validation set (ICR): for each fGS, HG1 and HG3 tumors were used to calculate molecular grade profiles; HG2 tumors were classified as fMG 1-like or fMG 3-like (top panel) and sorted according to their fuzzy molecular grade 3 score (bottom panel).
