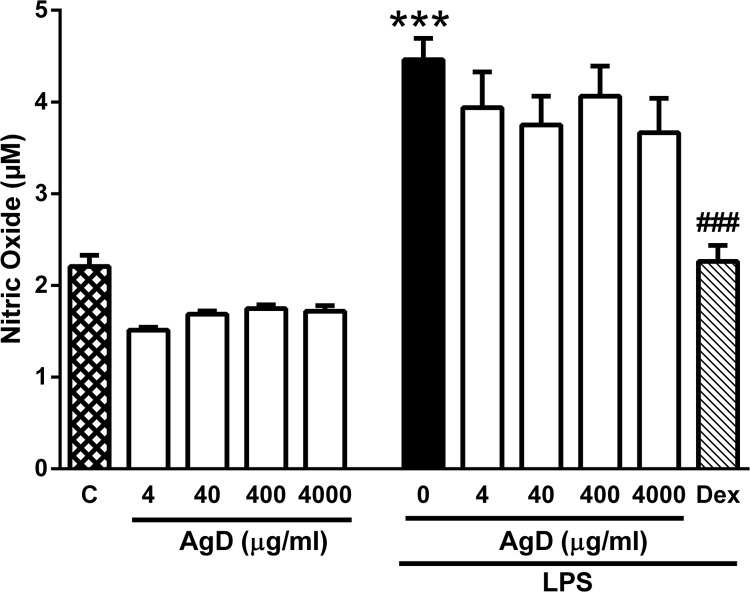
Fig 7. Effect of AgD on NO release by peritoneal macrophages.
Mouse peritoneal macrophages (106 cell/well) were treated with Aggregatin D (AgD, 4–4000 ng/ml) or with RPMI 1640 (control, C) in the presence or absence of lipopolysaccharide (LPS, 100 ng/ml). Positive control cells were treated with Dexamethasone (Dex, 9 μg/ml) in the presence of LPS. NO production was quantified through the Nitrite/nitrate production by the Griess method. Bars show the mean±s.e.mean of the nitrite/nitrate (μM) in quadruplicates. Symbols denote statistical difference in relation to control (RPMI) group (***P<0.001) or to LPS-treated group (### P<0.001).

