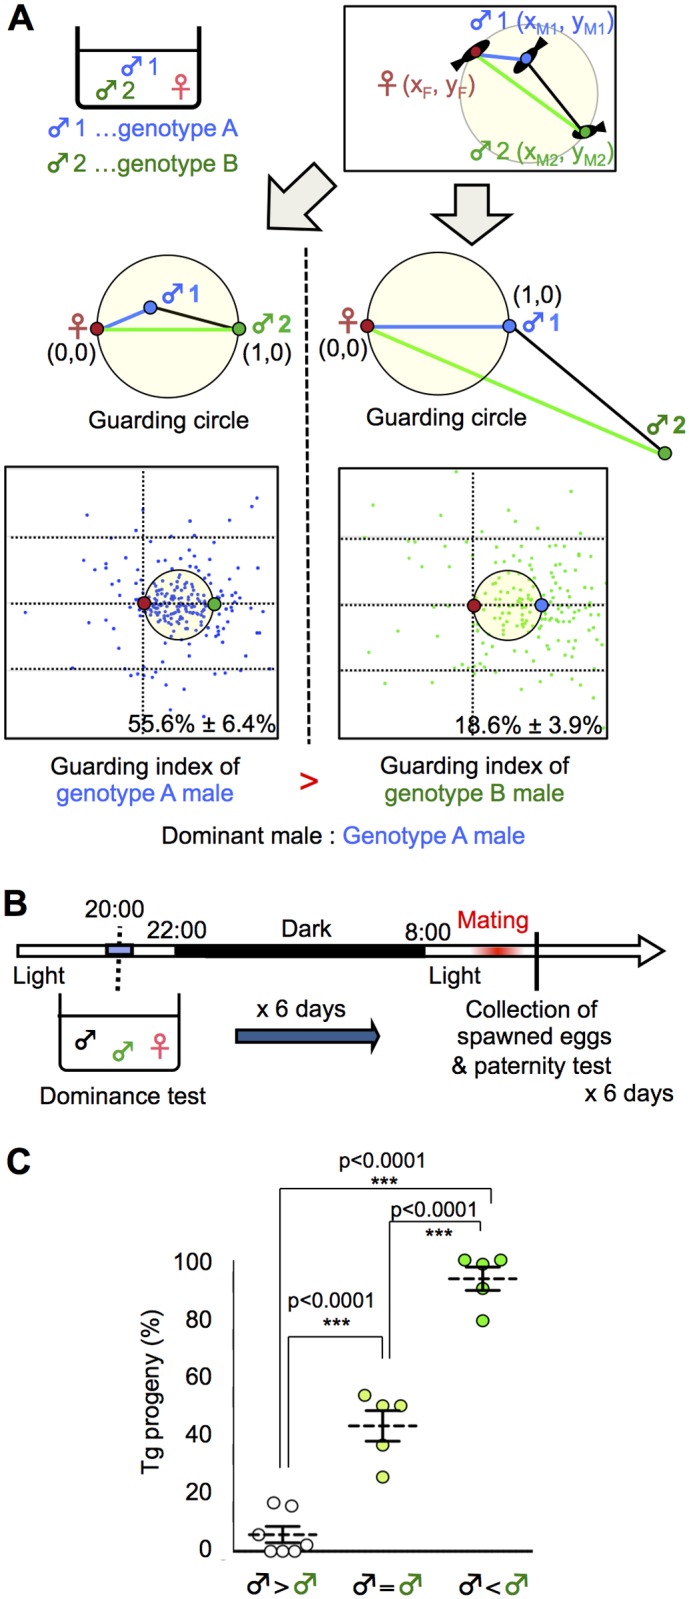
Fig 2. Dominance of mate-guarding in a triadic relationship.

(A) Comparison of the dominance in mate-guarding behavior (dominance test). We used one genotype A male and one genotype B male and measured their mate-guarding behavior when exposed to a female. We measured the relative locations of the three fish and calculated the probability of the genotype A male being in the guarding circle when the female and genotype B male positions were defined as (0, 0) and (1, 0), respectively (Left). We defined this probability as the “guarding index of genotype A”. In contrast, we also calculated the probability of the genotype B male being in the guarding circle when the female and genotype A male positions were defined as (0, 0) and (1, 0), respectively (Right). We defined this probability as the “guarding index of genotype B” and compared with that of genotype A. A higher guarding index indicates higher dominance in the mate-guarding behavior compared with the other male. (B) Time-course for the paternity test. (C) Higher mating success rate of the dominant male. ♂ < ♂: Guarding index of Tg male significantly higher than that of the wild-type male prior to mating and vice versa, ♂ = ♂: No significant difference between the two males. Mean ± SEM. n's = 7, 5, 5, respectively. one-way ANOVA: Scheffé’s post-hoc ***P<0.001.
