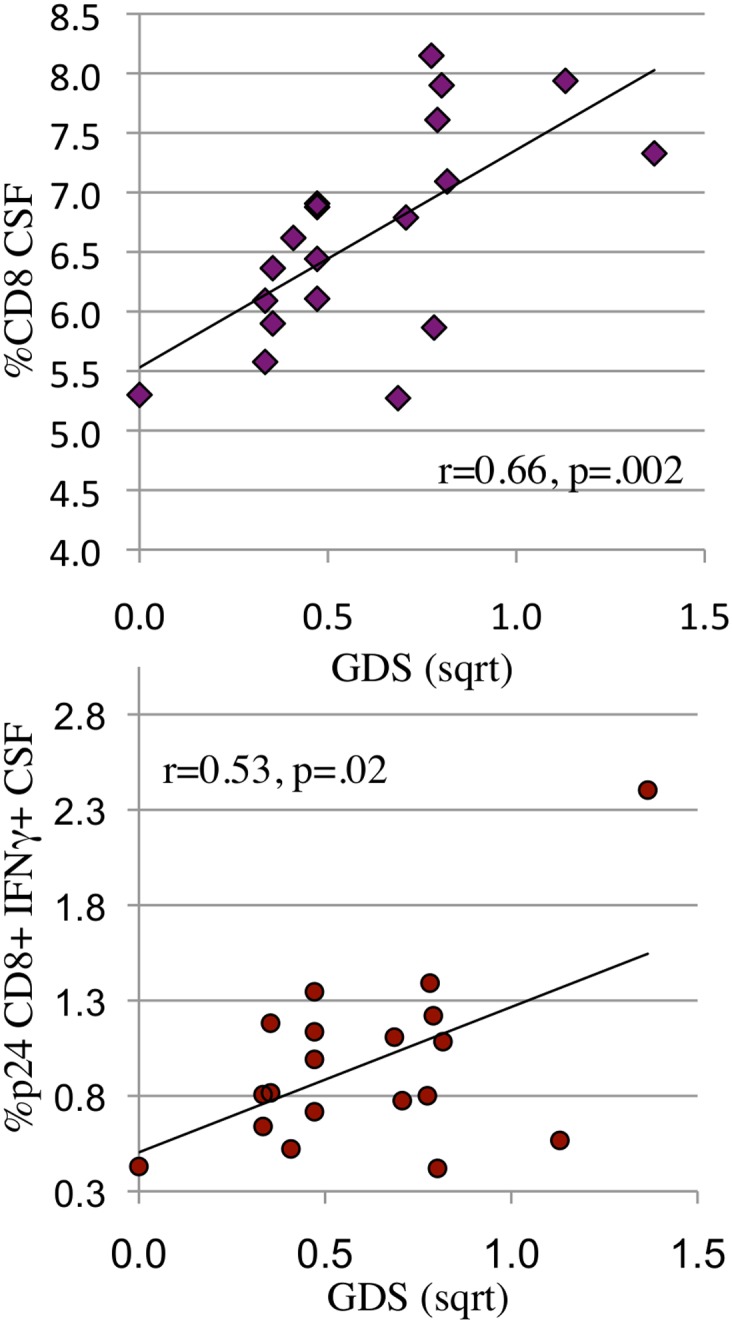
Fig 6. When HIV RNA is suppressed, the percent of CD8+ T-cells in CSF (6a) and the percent of HIV specific CD8+ IFNγ+ T-cells in CSF (6b) both correlate with severity of NCI (GDS).

a, b: When HIV RNA was suppressed in CSF, CD8+ T-cells (6a: r = 0.66, p = 0.002) and HIV p24 induced CD8+ T-cell IFNg expression (6b: r = .53, p = 0.02) correlated positively with NCI (GDS). Cell numbers, expression levels and GDS were square root transformed.
