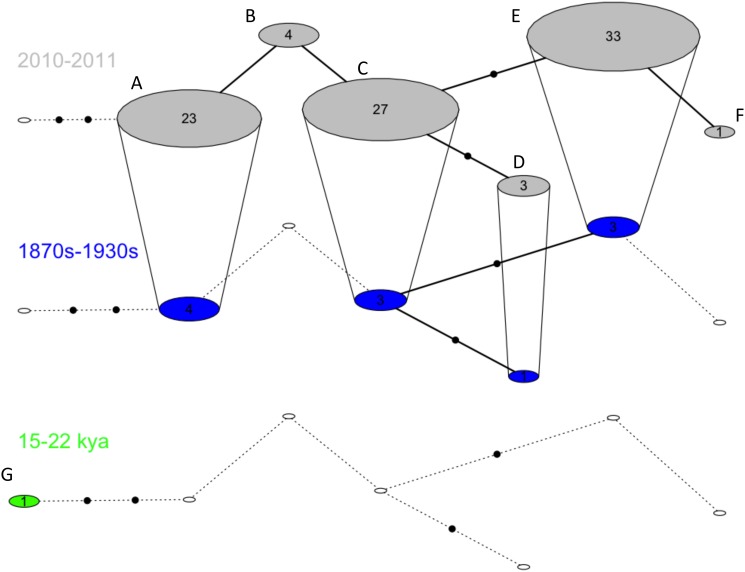
Fig 2. Temporal haplotype network displaying the relationships of kea haplotypes for 450 bp of the mitochondrial control region through time.
Haplotypes are represented by circles and numbers represent sample size. Empty circles represent absent haplotypes for a given time period. Haplotypes found in multiple time period are connected by vertical lines. Within each time period, black dots represent one mutation.

