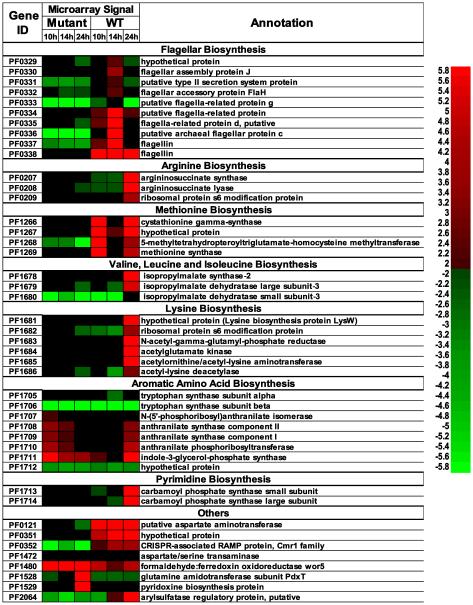
Figure 4.
Heat plot showing ORFs responding to growth phase transitions for the wild-type (WT) and mutant P. furiosus strains growing at 80°C. For the heat plot, red indicates higher transcript levels (log2(fold change)>1), green indicates lower (log2(fold change)<-1), and black denotes average transcript levels (The color scale for least squares mean from mixed effects ANOVA model shown on the right, where 0 is average transcript level).

