
Fig. 1. Palmitate induces expression of ER stress markers.
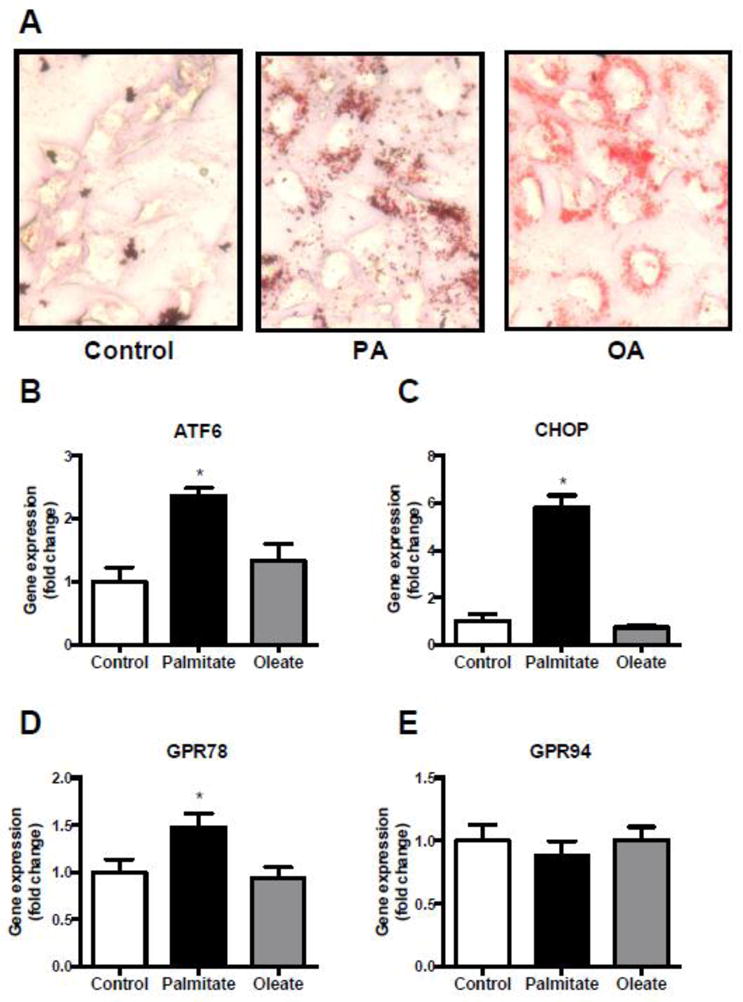
(A) Oil-red-O staining of cardiomyocytes after overnight incubation with 400μM BSA-coupled palmitate (PA), OA(OA) or BSA with methanol as a control (magnification x40). (B–E) Gene expression of the ER stress markers ATF6 (B), CHOP (C), GRP78 (D) and GRP94 (E) after overnight treatment with 400μM BSA-coupled palmitate (PA), oleate (OA) or solely BSA and methanol as a control. Data are presented as fold change in gene expression relative to the control group. *P<0.05, n=4, error bars represent SEM.