
Fig. 3. PPARγ overexpression reduces palmitate-induced ER stress in cardiomyocytes.
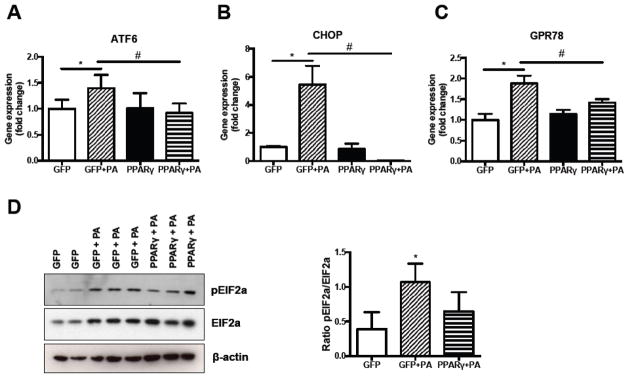
(A–C) Reduction in palmitate-induced induction of ER stress markers ATF6 (A), CHOP (B) and GRP78 (C) upon PPARγ overexpression. N=3–4. (B) Representative Western Blot and quantification of eIF2a phosphorylation. PA: palmitate. N=3. *P<0.05 BSA-control versus palmitate within groups, #P<0.05 PPARγ versus GFP, error bars represent SEM.