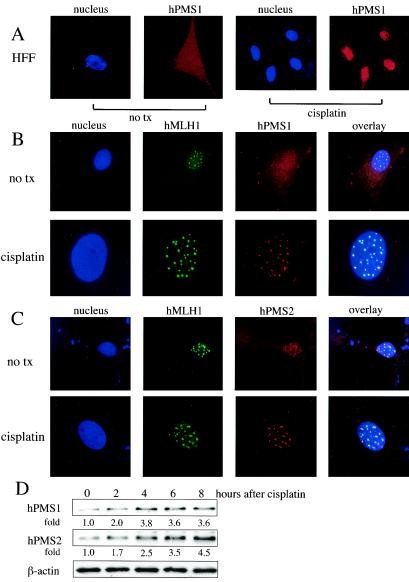
FIG. 8.
Localization of endogenous hPMS1, hPMS2, and hMLH1 proteins in primary HFFs. (A) Endogenous hPMS1 was distributed throughout the cells but was relocalized to nucleus by cisplatin treatment in primary HFFs. HFFs were either left untreated or treated with cisplatin (50 μM) for 6 h. hPMS1 was immunostained with its specific antibody followed by Texas Red X-conjugated anti-rabbit IgG. Nuclei were stained with Hoechst 33258. Images are representative of 99% of 300 cells examined. (B) Endogenous hMLH1 formed discrete nuclear foci and colocalized with nuclear hPMS1 in these foci. HFF were treated with cisplatin as described for panel A. The immunostaining was performed with specific antibodies against hMLH1 (monoclonal) and hPMS1 (polyclonal) followed by fluorescein isothiocyanate-conjugated anti-mouse IgG and Texas Red X-conjugated anti-rabbit IgG. Nuclei were stained with Hoechst 33258. Images are representative of at least 95% of 300 cells examined. no tx, no cisplatin treatment. (C) Endogenous hPMS2 is distributed throughout the cells but is relocalized to nuclei by cisplatin treatment and colocalized with hMLH1. HFF were treated and the immunostaining was performed as described for panel B except that an antibody for hPMS2 (polyclonal) was used to detect hPMS2. The images in the upper panels represent 89% of 300 cells examined. The other 11% of cells showed a whole-cell staining pattern of hPMS2 without nuclear foci. The images in the lower panels are representative of 93% of 300 cells examined (7% of cells had a nuclear hPMS2 pattern without foci). (D) HFFs were treated with cisplatin (50 μM) for the indicated periods of time. Total cellular lysates were subjected to Western blot analysis to detect endogenous hPMS1 and hPMS2. The relative intensity of the signals was quantified by densitometry and compared to that seen with the 0-h sample.

