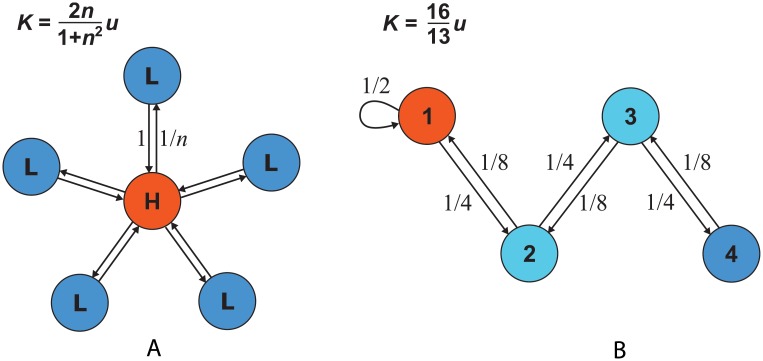
Fig 3. Asymmetric spatial structure affects the rate of neutral substitution.
This is because the frequency of mutations and the probability of fixation differ across sites. Turnover rates are indicated by coloration, with red corresponding to frequent turnover and consequently frequent mutation. (a) A star consists of a hub and n leaves, so that the population size is N = n+1. Edge weights are chosen so that the birth rates are uniform (b i = 1 for all i). Solving Eqs. (1)–(2), we obtain site-specific fixation probabilities of ρ H = 1/(1+n 2) and ρ L = n/(1+n 2) for the hub and each leaf, respectively. From Eq. (4), the molecular clock rate is , which equals u for n = 1 and is less than u for n ≥ 2. Thus the star structure slows down the rate of neutral substitution, in accordance with Result 3. Intuitively, the slowdown occurs because mutations are more likely to arise at the hub, where their chances of fixation are reduced. (b) A one-dimensional population with self-replacement only in site 1. Solving Eqs. (1)–(2) we find , , and . (The powers of two arise because there is twice as much gene flow in one direction as the other.) From Eq. (4), the molecular clock rate is , thus the molecular clock is accelerated in this case.

