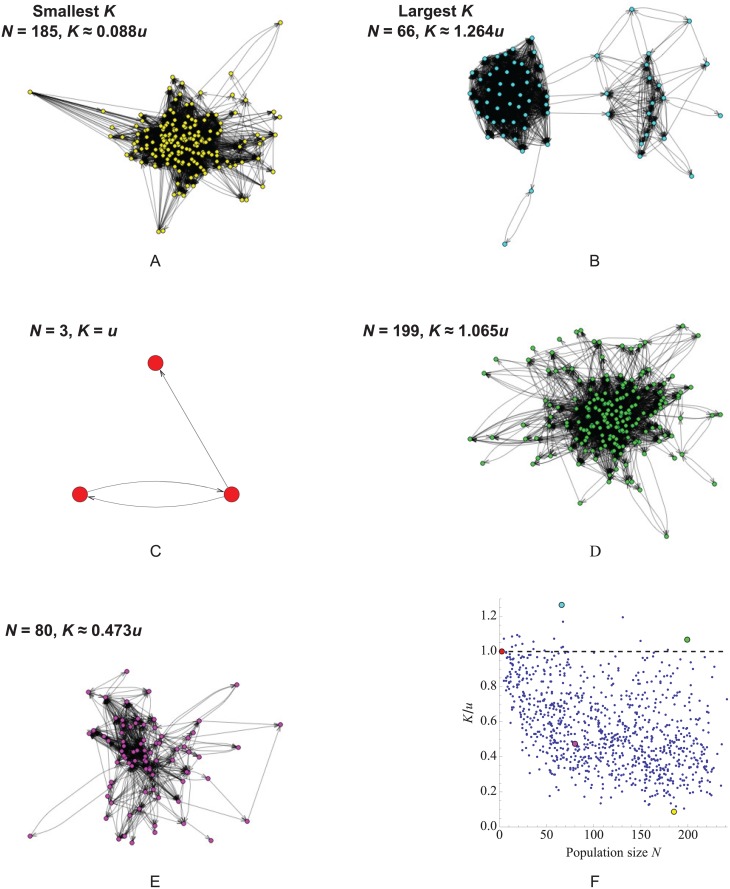
Fig 8. The rate of neutral substitution K on Twitter “ego networks”.
(a–e) Five of the 973 networks analyzed, including those with (a) the largest value of K, (b) the smallest value of K, and (c) the fewest nodes. (f) A scatter plot of K/u versus N reveals a weak negative correlation (slope ≈ −0.00164 with 95% confidence interval (−0.0023, −0.001) based on the bootstrap method; R ≈ −0.45). The colored dots on the scatter plot correspond to the networks shown in (a–e). The dashed line corresponds to K/u = 1, above which network topology accelerates neutral substitution.

