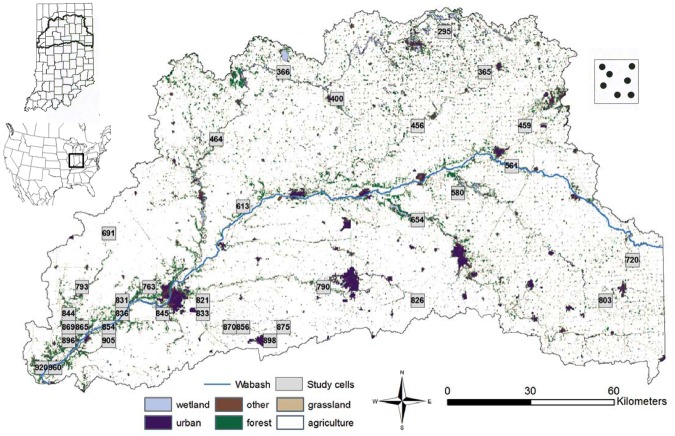
Fig 1. Map of study area in northern Indiana showing distribution of study cells.
The blue line corresponds to the Wabash River, and land cover is colored. Right inset demonstrates several sample sites within each study cell. Left inset shows the study area location in North America and Indiana with counties outlined. All study cells are labeled by their ID.

