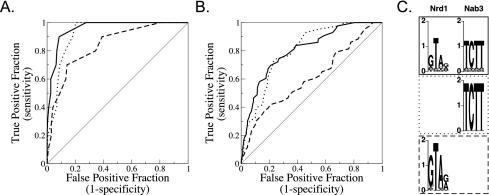
FIG. 8.
Tests of models predicting non-poly(A) terminators in the S. cerevisiae genome. (A) Receiver operator characteristic (ROC) curves (15) for the training set compared to those for all other open reading frames, snRNAs, and snoRNAs, using the optimized binding models for Nrd1 alone (dashed), Nab3 alone (dotted), and cooperative Nrd1-Nab3 binding (solid). (B) ROC curves for test set RNA genes compared to those for the nontest set. The models and parameters are the same for the training set curves and the test set curves. The ROC curve for a random regulatory model that has no predictive value at all would run along the diagonal, while a ROC curve for a perfectly predictive regulatory model would run up the y axis and then along the top of the plot. (C) Sequence logo representations (31) of the binding specificities of Nrd1 and Nab3 optimized for the cooperative model, Nrd1 alone, and Nab3 alone. The y axis shows bits of information. The line patterns of the boxes surrounding the sequence logos correspond to the lines in the ROC curves.

