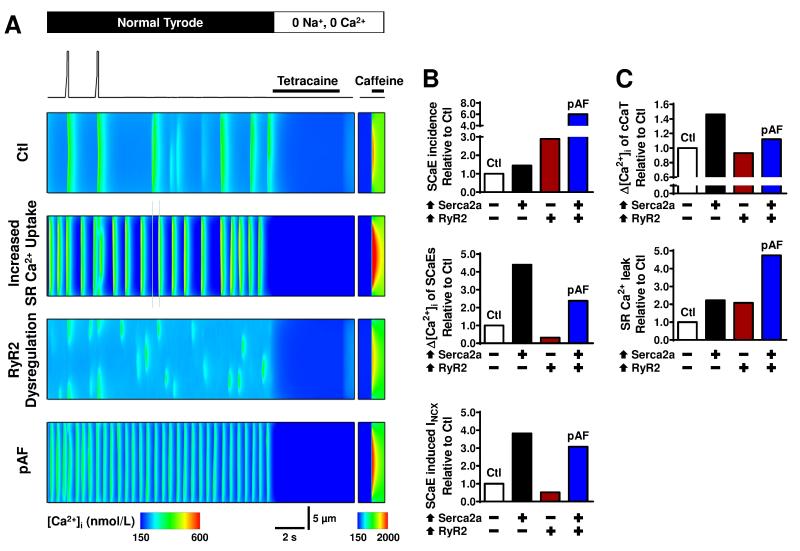
Figure 8.
Computational analysis of SR Ca2+-leak and spontaneous Ca2+-release events (SCaEs). A. Voltage-clamp protocol and transverse line-scan representation of [Ca2+]i at center of virtual cell in the Ctl model, Ctl model with increased SR Ca2+-uptake, Ctl model with RyR2 dysregulation and pAF model combining both elements (top to bottom). The protocol shows the two final depolarization-triggered Ca2+-transients at steady state, followed by a quiescent period to assess SCaEs, and simulated application of tetracaine and caffeine to determine SR Ca2+-leak and SR Ca2+-load. B. Quantification of incidence (top) and average amplitude (middle) of SCaEs. Bottom panel shows amplitude of SCaE-induced membrane currents. Results are presented as relative changes versus Ctl for increased SR Ca2+-uptake (⬆Serca2a), RyR2-dysregulation (⬆RyR2), and pAF models. C. Similar to panel B for SR Ca2+-load (top) and SR Ca2+-leak (bottom).

