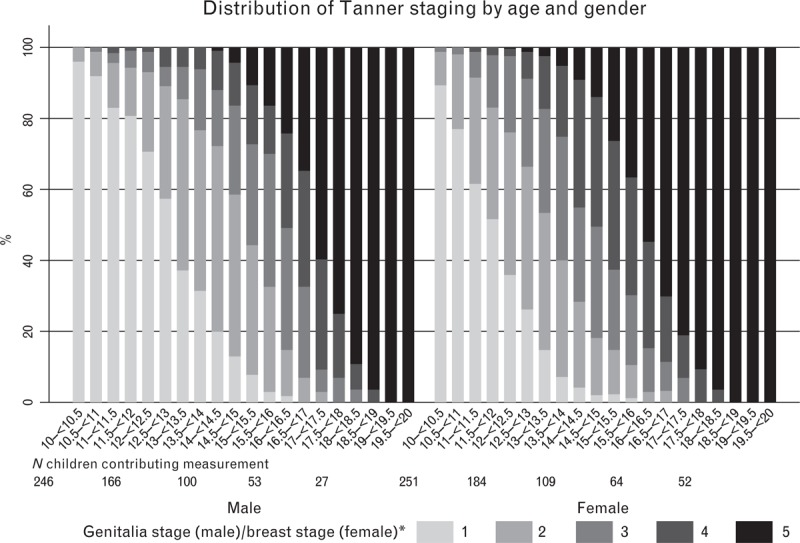
Fig. 1.
Distribution of Tanner staging by age and sex.

Including closest to mid-point measurement per child in each age range. (∗) 1 = pre-pubertal to 5 = adult.
Distribution of Tanner staging by age and sex.

Including closest to mid-point measurement per child in each age range. (∗) 1 = pre-pubertal to 5 = adult.