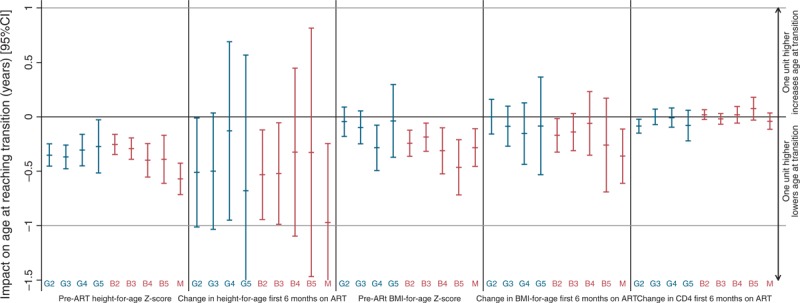
Fig. 3.
Impact of height/BMI-for-age Z-scores at ART initiation and change in height/BMI-for-age during the first 6 months on ART on age on reaching each Tanner stage and menarche (interval regression).

Tanner staging of genitalia (G1 = pre-pubertal to G5 = adult) in males or breasts (B1 to B5) in females; M, menarche. Z-score effects are per unit higher; CD4+ effects per 100 cells/μl higher. Confidence intervals (CIs) for impact of change in height-for-age on age at reaching G5 and menarche truncated at −1.5. See Figure 2 for the effect of age at ART initiation. For point estimates and values within a 95% CI below the line at y = 0, one unit higher value lowers the age at which the Tanner stage is attained. For point estimates and values within a 95% CI above the line at y = 0, one unit higher value raises the age at which the Tanner stage is attained. ART, antiretroviral therapy.
