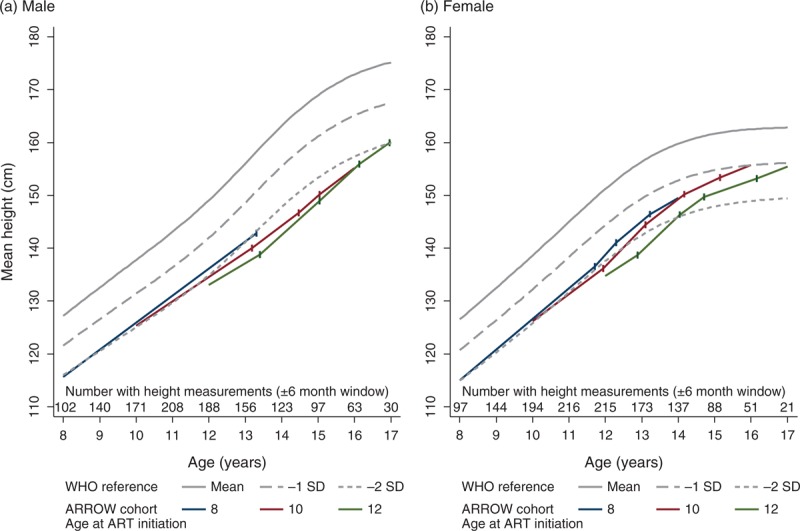
Fig. 4.
Dependence of growth on Tanner staging and age at antiretroviral therapy initiation in comparison to WHO growth standards.

Each solid coloured line indicates the estimated height at ART initiation, and subsequent growth for a child aged 8, 10 or 12 years at ART initiation, in comparison with WHO standards (grey lines). Vertical lines indicate the expected age at each Tanner transitions for these ages at ART initiation (estimated at reference categories for other significant predictors as per Figure 2, i.e. for a Zimbabwean child with height and BMI-for-age −2 and −1 at ART initiation, and −2 and −0.7 six months after ART initiation; and 250 cells/μl increase in CD4+ during the first 6 months on ART). Growth predictions assume linear growth in between these transitions (as per multilevel models; see Methods section). ART, antiretroviral therapy.
