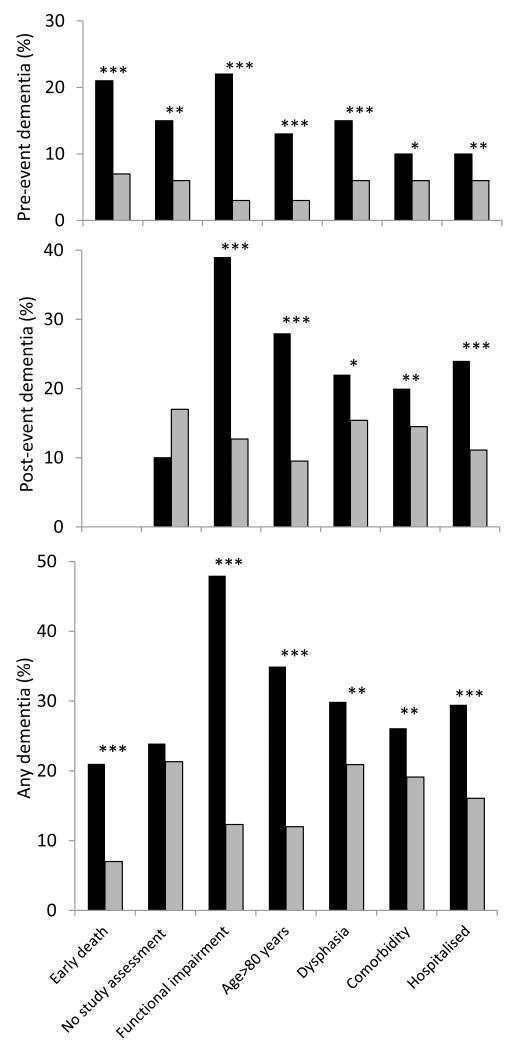
Figure 2.
Top graph: percentage of population with pre-event dementia. Middle graph: percentage of patients surviving to ascertainment with post-event dementia to 1-year (cumulative incidence excluding pre-event dementia). Bottom graph: percentage of population with any (pre and post-event) dementia to 1-year. Black bars indicate those with versus without (grey bars) specific baseline exclusion criteria, ***p<0.001, **p<0.01, *p<0.05.

