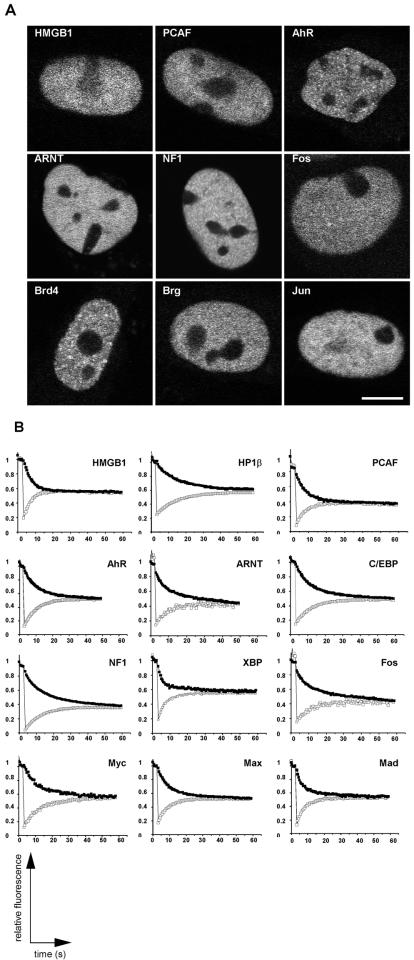
FIG. 2.
Localization and FRAP recovery and loss curves for chromatin-associated proteins. (A) Most fusion proteins were homogeneously distributed within the nucleus and excluded from the nucleolus. (B) The indicated proteins were imaged before and during recovery after bleaching of about half the nuclear area. Average fluorescence intensities in the bleached (open squares) and the unbleached region (solid squares) were measured over time. The fluorescence signal equilibrated in most cases within about 30 to 60 s, suggesting rapid exchange of proteins on chromatin. Convergence of the two curves indicates the absence of any substantial immobile, stably bound fraction. Values are averages ± standard deviation from at least 10 cells from three experiments.

