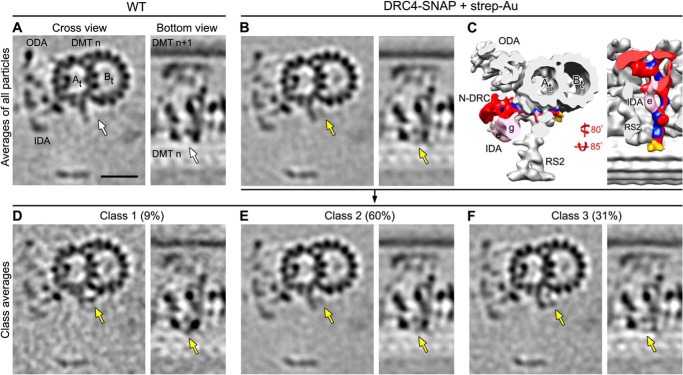
FIGURE 4.
Classification analysis shows high labeling efficiency of DRC4-SNAP. Tomographic slices (A, B, and D–F) and isosurface renderings (C) of the averaged 96-nm axonemal repeats in cross-sectional (from distal; left image) and bottom view orientation (right image) show the presence of the SNAP-biotin-strep-Au density at the end of the N-DRC base plate in labeled DRC4-SNAP axonemes (golden arrows in B); this density does not appear in the unlabeled averaged WT (white arrows in A). The subtomogram average of all axonemal repeats from labeled DRC4-SNAP (B and C) was classified (D–F) focusing on the region with the label density; the results revealed three distinct classes 1–3 (D–F) that show the additional density of the biotin-strep-Au label (golden arrows) in slightly different positions, suggesting that the label is somewhat flexible and can pivot with the (PEG)12-linker around the SNAP tag of the fusion protein, i.e. at the C terminus of DRC4. The biotin-strep-Au density was nevertheless observed in all three classes, indicating nearly 100% labeling efficiency. Other labels are as follows: At, A-tubule; Bt, B-tubule; IDA e/g, inner dynein arms e and g; N-DRC, nexin-dynein regulatory complex; ODA, outer dynein arms; RS2, radial spoke 2. Scale bar, 20 nm.

