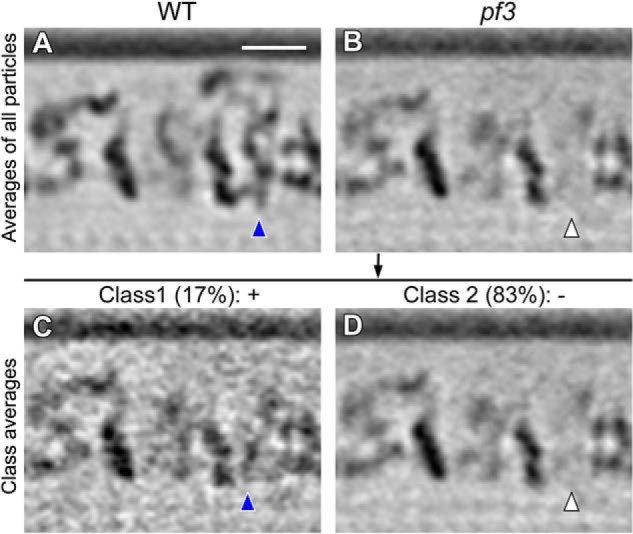
FIGURE 6.

Classification analysis of pf3 axonemes reveals that the N-DRC base plate is not completely missing. Tomographic slices of the averaged 96-nm axonemal repeats in longitudinal bottom view (orientation similar to the right image in each panel of Fig. 4) show the presence of the N-DRC base plate in all WT (A, blue arrowhead) and in 17% of the pf3 axonemal repeats (C, blue arrowhead). As the density of the N-DRC base plate is missing from 83% of the pf3 axonemal repeats (D, white arrowhead), it is hardly visible in the average of all pf3 axonemal repeats (B, white arrowhead). Classification analysis was performed focusing on the base plate region of the N-DRC. Scale bar, 20 nm.
