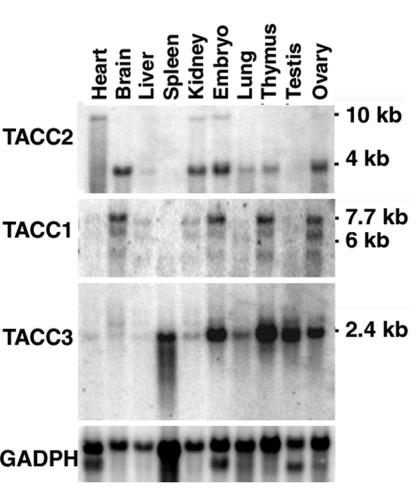
FIG. 1.
Tissue distribution of TACC transcripts in the mouse. Northern blot analysis was performed with poly(A)+ RNA samples from different murine tissues. The blot was subsequently hybridized with probes specific for TACC2 (top panel), TACC1 (second panel), and TACC3 (third panel). Hybridization for GAPDH (fourth panel) was used to control RNA loading. Positions of standard markers and TACC transcript sizes in kilobases are indicated.

