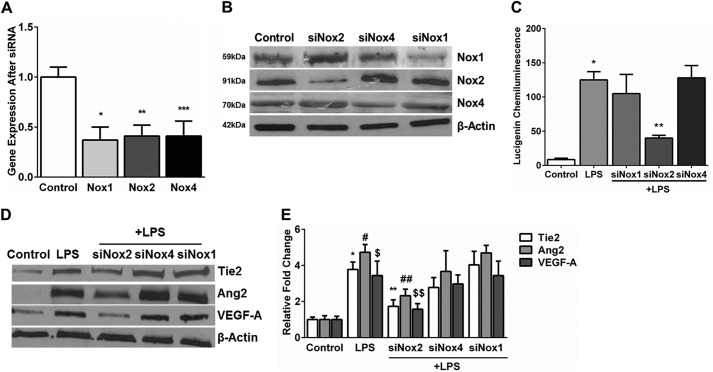
FIGURE 4.
Effect of Nox1, Nox2, and Nox4 silencing on LPS-induced superoxide production in HPMECs. A, mRNA expression of Nox1, Nox2, and Nox4 quantified 48 h after silencing by real-time PCR. 18 S was used as a housekeeping gene. Expression is relative to untreated controls. *, p = 0.003 (control versus Nox1); **, p < 0.001 (control versus Nox2); ***, p < 0.001 (control versus Nox4) (n = 4). B, Nox1, Nox2, and Nox4 protein expression was quantified in cell lysates by immunoblotting after silencing with the respective siRNA. C, superoxide formation was quantified in HPMECs 15 min after LPS treatment under various test conditions using a lucigenin-derived chemiluminescence assay. *, p < 0.001 (control versus 15 min LPS); **, p < 0.005 (LPS versus siNox2 + LPS) (n = 3). D and E, Tie2, Ang2, and VEGF-A protein expression was examined in cell lysates 24 h after LPS treatment by immunoblotting (D), and blots were quantified by densitometry (E). *, p < 0.001 (control versus LPS); #, p < 0.001 (control versus LPS); $, p < 0.001 (control versus LPS); **, p < 0.001 (control versus siNox2 + LPS); ##, p = 0.008 (control versus siNox2 + LPS); $$, p = 0.008 (control versus siNox2 + LPS) (n = 4).

