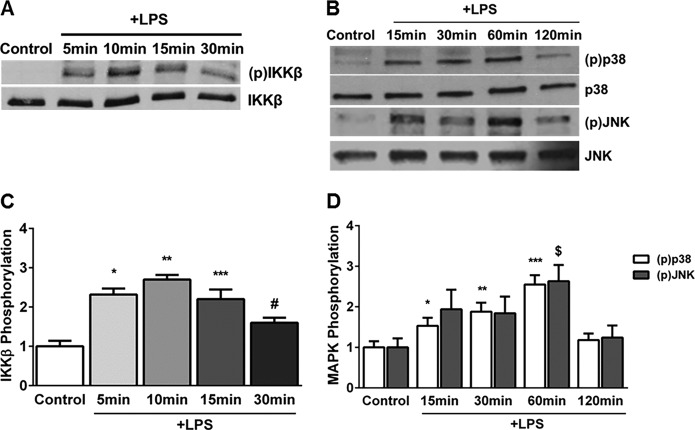
FIGURE 6.
Temporal changes in LPS-induced IKKβ, p38, and JNK phosphorylation in HPMECs. A and C, IKKβ phosphorylation was assessed in cell lysates after LPS treatment by Western blotting (A), and blots were quantified by densitometry. The mean –fold change in IKKβ phosphorylation relative to untreated controls from four experiments is shown (C). *, p < 0.001 (control versus 5 min LPS); **, p < 0.001 (control versus 10 min LPS); ***, p < 0.001 (control versus 15 min LPS); #, p = 0.003 (control versus 30 min LPS) (n = 4). B and D, Western blot (B) showing changes in p38 and JNK (MAPK) phosphorylation with LPS treatment at 15, 30, 60, and 120 min. The mean -fold-change in p38 and JNK phosphorylation relative to controls was quantified by densitometry (D). *, p = 0.001 (control versus 15 min LPS); **, p < 0.001 (control versus 30 min LPS); ***, p < 0.001 (control versus 60 min LPS); $, p = 0.001 (control versus 60 min LPS) (n = 4).

