FIGURE 2.
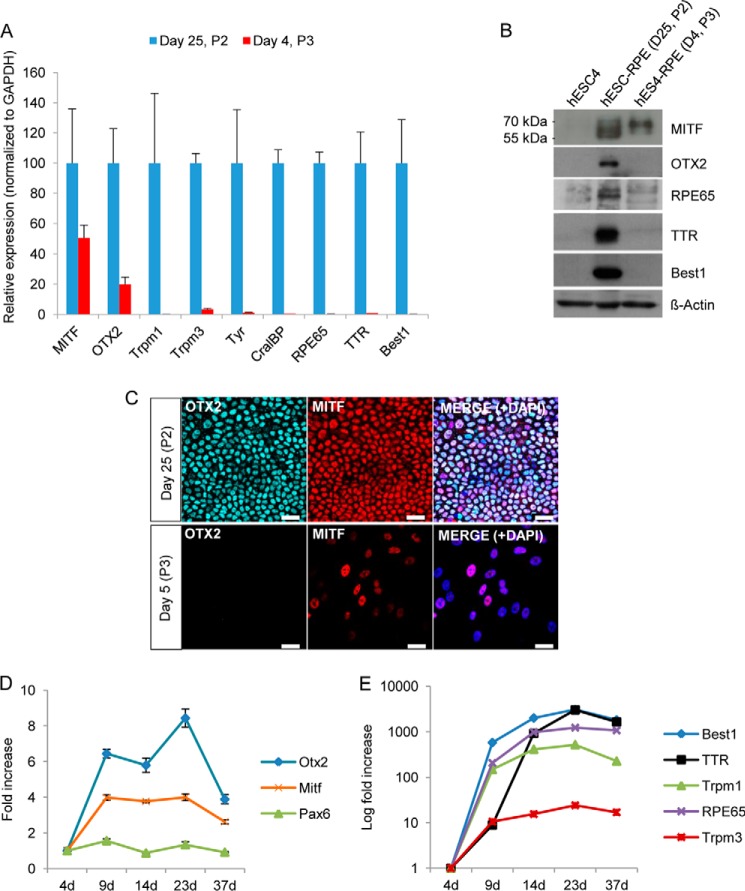
Molecular characterization of subconfluent and postconfluent polygonal hESC-RPE cells. To compare the relative expression of RPE-related genes before (passage 2 (P2), day 25) and after (passage 3, day 4) cell passage, qRT-PCR was performed (A). The graph represents the relative gene expression of P2 cells cultured for 25 days (normalized to GAPDH). Data are presented as the mean ± S.D. of three replicates. B, Western blot analysis of the same experiment as in A shows that RPE-specific proteins are down-regulated after passage. D, day. C, immunofluorescence detection of confluent polygonal RPE cells and subconfluent cells (5 days after passage), showing expression of OTX2 and MITF. DAPI was used to counterstain the nuclei (blue). Scale bars = 25 μm. D and E, relative mRNA levels determined by qRT-PCR of RPE-specific genes at different time points after passage (P3). mRNA levels were normalized to GAPDH and plotted relative to day 4 (4d).

