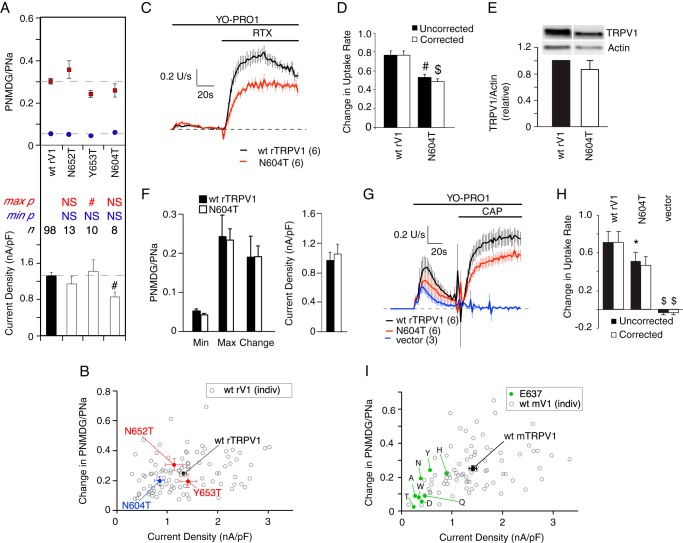
FIGURE 9.
RTX-evoked large cation permeability in heat-insensitive or glycosylation-deficient rat TRPV1 mutants. A, top, minimum (blue symbols) and maximum (red symbols) PNMDG/PNa evoked by 1 μm RTX. Bottom, peak sodium current density measured at +20 mV. Dashed lines indicate wild type values. Data are presented as mean ± S.E. *, p < 0.05; #, p < 0.01; $, p < 0.001; NS, not statistically significant (mutant versus wild type, unpaired Student's t test). B, change in PNMDG/PNa plotted as a function of peak sodium current density for wild type and mutant TRPV1. Open symbols represent individual wild type recordings. Colored symbols represent population means for wild type (black), heat-insensitive (red), and glycosylation-deficient (blue) TRPV1 channels. Error bars represent S.E. Wild type data are reproduced from Fig. 1. C, rate of YO-PRO1 uptake via wild type or rTRPV1-N604T channels, during stimulation with 1 μm RTX. Data were normalized to the average maximum dye uptake rate recorded from wild type coverslips on the same day and are presented as mean ± S.E. averaged across the number of coverslips indicated in parentheses. D, change in rate of YO-PRO1 uptake from baseline, measured just prior to RTX addition, to the period 60–80 s after RTX addition, without (black bars) and with (white bars) correction for channel protein expression. Data were normalized to the maximum change in dye uptake rate recorded from wild type coverslips on the same day and are presented as mean ± S.E. *, p < 0.05; #, p < 0.01; $, p < 0.001 (mutant versus wild type, unpaired Student's t test). E, immunoblot analysis of TRPV1 and actin expression in transfected HEK293 cells. Mutant N604T channel expression was normalized to expression of wild type TRPV1 from concurrent transfections. Data are presented as mean ± S.E. from three independent transfections per group. No S.E. is presented for wild type. F, left, values for minimum, maximum, and change in PNMDG/PNa evoked by 1 μm capsaicin in wild type and rTRPV1-N604T channels. Right, peak sodium current density measured at +20 mV. Data are presented as mean ± S.E. Wild type, n = 11; N604T, n = 8. G, rate of YO-PRO1 uptake via wild type or rTRPV1-N604T channels, during stimulation with 1 μm capsaicin. Data were normalized to the average maximum dye uptake rate recorded from wild type coverslips on the same day and are presented as mean ± S.E. averaged across the number of coverslips indicated in parentheses. H, change in rate of YO-PRO1 uptake from baseline, measured just prior to capsaicin addition, to the period 60–80 s after capsaicin addition, without (black bars) and with (white bars) correction for channel protein expression. Data were normalized to the maximum change in dye uptake rate recorded from wild type coverslips on the same day and are presented as mean ± S.E. *, p < 0.05; #, p < 0.01; $, p < 0.001 (mutant versus wild type, unpaired Student's t test). I, change in PNMDG/PNa plotted as a function of peak sodium current density for wild type and mTRPV1-E637 mutant populations. Open symbols represent individual wild type recordings. Colored symbols represent population means for wild type (black) and mutant (green) channels. Specific amino acid substitutions are indicated. Error bars represent S.E. Wild type NMDG permeability data are reproduced from Fig. 1.

