FIGURE 3.
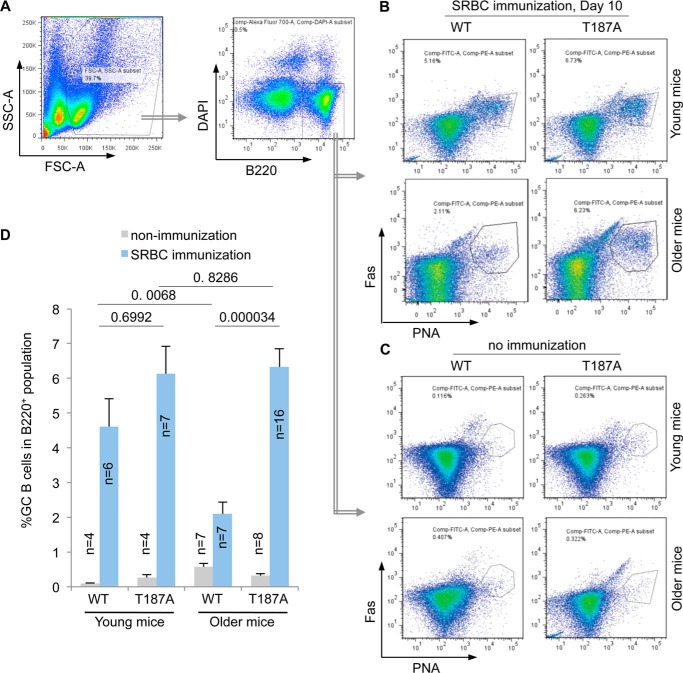
Production of spleen GC B cells following SRBC immunization decline with age in WT but not p27T187A/T187A mice. A, FACS of total spleen cell suspension, showing the first FSC-SSC gate, followed by the B220 and DAPI gate. DAPIlow,B220high cells then underwent FACS on PNA and Fas to determine population sizes of GC B cells (PNAhigh and Fashigh) in total B cell population at day 10 following SRBC immunization (B) or from unimmunized mice (C). Quantifications of B and C are shown in D. Error bars represent S.E. Two-way ANOVA with these four groups of data from immunized mice showed p = 0.0850 for differences between young and older, and p = 0.0001 for differences between WT and T187A. Unpaired two-tailed Student's t tests were used to determine p values between various sample pairs as shown in D.

