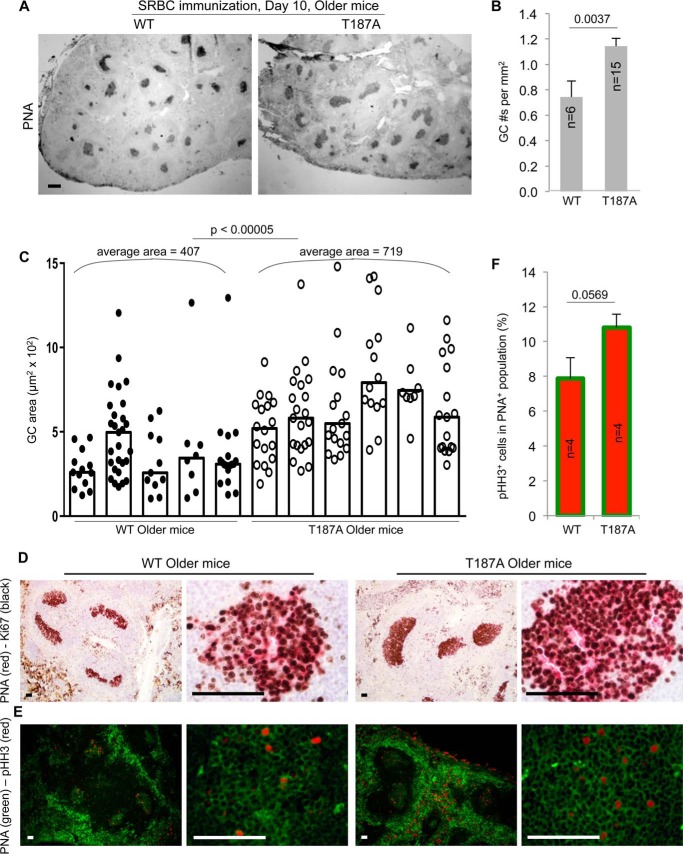
FIGURE 4.
Spleen GC numbers and sizes are higher and larger in older p27T187A/T187A mice than in older WT mice at 10 days following SRBC immunization. A, representative images of spleen sections stained with PNA to visualize GC. Scale bars, 200 μm. B, quantifications of GC numbers on spleen sections, error bars are S.E. C, quantifications of GC sizes. Each column represents one individual, and each point is an individual GC. Column heights represent medians. Co-staining of Ki67 (black) and PNA (red) (D), and pHH3 (red) and PNA (green) (E), of GC were performed on spleen sections as marked. Scale bars, 50 μm. F, quantification of data in E. p values are from two-tailed Student's t tests.

