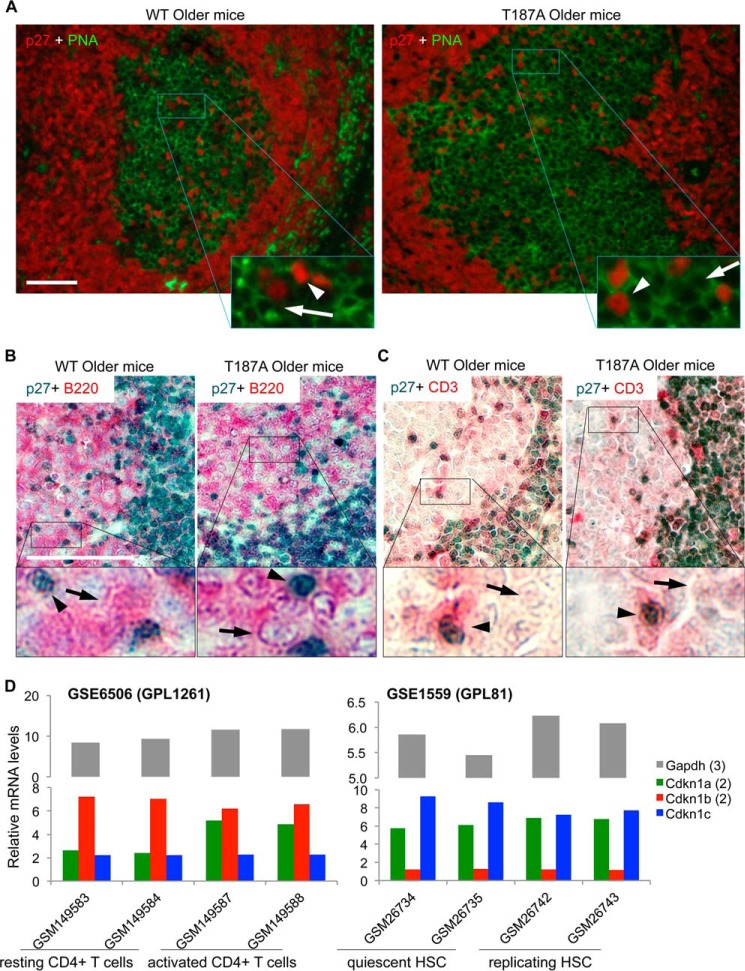
FIGURE 6.
p27 expression is dramatically reduced in GC B cells but maintained in GC T cells in older WT and older p27T187A/T187A mice at 10 days following SRBC immunization. A, high magnification and red-green channel merge images of co-IF for p27 and PNA, as indicated, of representative GC, as marked. In enlarged areas, white arrows point to cells with membrane staining by PNA but negative for p27, while white arrowheads point to cells with positive staining for p27 without membrane PNA staining. B, two-color co-IHC for p27 (dark blue) and B cell marker B220 (pink), as marked, showing approximately one-quarter of a GC. Black arrows point to cells with positive membrane staining for B220 but negative for p27, while black arrowheads point to cells with positive p27 staining but negative for B220 membrane staining. C, same experiments as in B, except B220 antibody was replaced with CD3 antibody. D, in NCBI GEO database, gene expression profiles for naïve and activated CD4+ T cells (GSE6506) and quiescent and replicating HSC (GSE1559) were queried for expression of p21 (Cdkn1a, average of 2 probe sets), p27 (Cdkn1b, average of 2 probe sets), and p57 (Cdkn1c), as well as a housekeeping gene Gapdh (average of 3 probe sets). Sample records (GSMxxx) and experimental platforms (GPLxxx) are shown. Data in both datasets were normalized by GC-RMA, and two biological replicates were analyzed.

