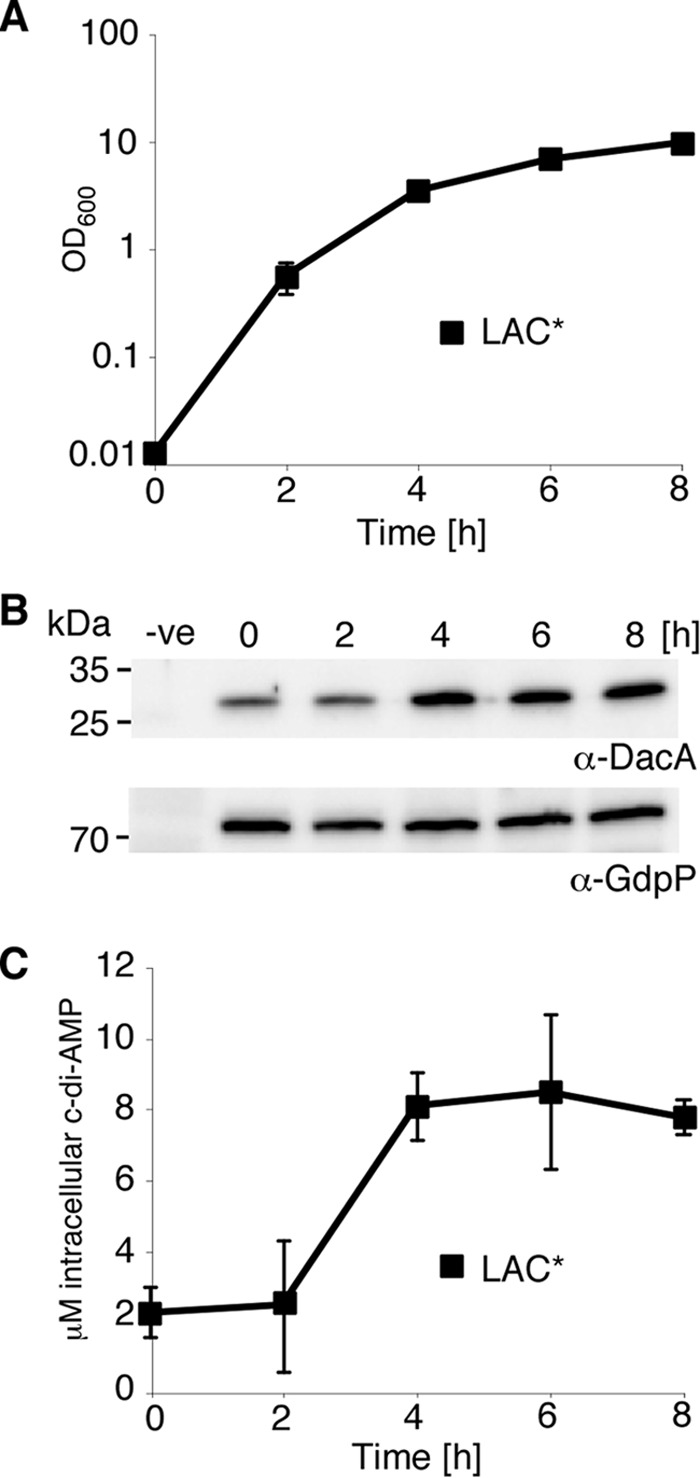
FIGURE 1.

c-di-AMP levels vary during the growth of S. aureus. A, growth curve of S. aureus strain LAC*. LAC* was diluted to an A600 of 0.01 and grown to the exponential phase prior to dilution to an A600 of 0.01 (time = 0 h), and growth was monitored and recorded for 8 h. The average A600 values and standard deviations from three independent experiments were plotted. B, DacA and GdpP protein production during the growth of S. aureus strain LAC*. Samples were taken at the indicated time points from an S. aureus LAC* culture; whole cell lysates were prepared, and the DacA and GdpP proteins were detected by Western blot using protein-specific antibodies. Samples prepared from LAC*idacA grown in the absence of Atet for 2 h (see Fig. 2A) and LAC*ΔgdpP cultures (Fig. 3A) were used as negative controls on DacA and GdpP Western blots, respectively. All protein band intensities were quantified using ImageJ. The positions of protein molecular mass markers (in kDa) are indicated on the left. C, intracellular c-di-AMP levels. The intracellular concentration of c-di-AMP during the growth of strain LAC* was determined by LC-MS/MS and its micromolar concentration calculated. The average values and standard deviations of three independent experiments are plotted.
