FIGURE 7.

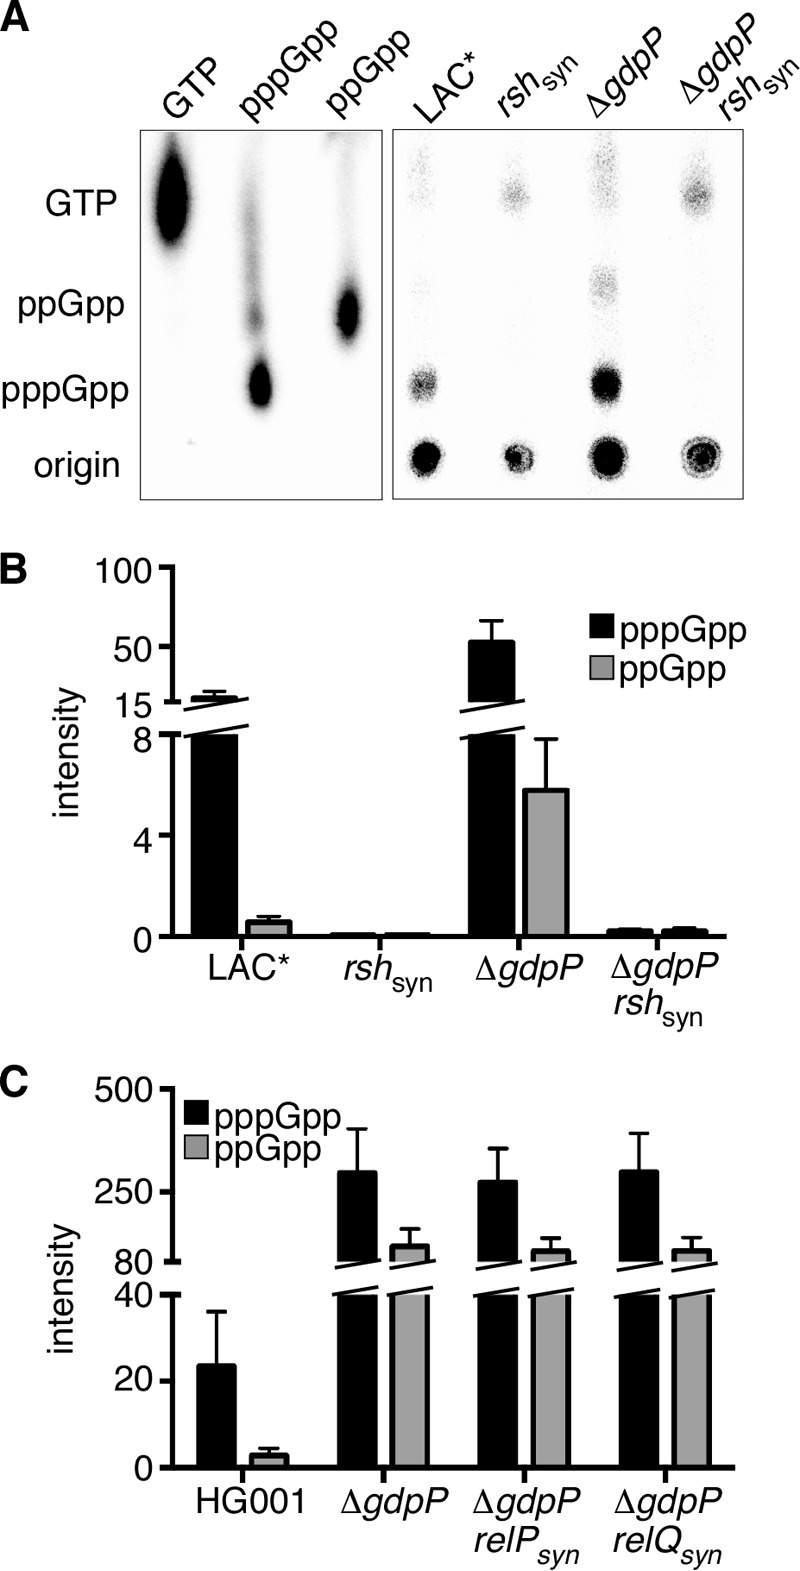
Measurement of intracellular (p)ppGpp levels. A, strains LAC*, LAC*ΔgdpP, LAC*rshsyn, and LAC*rshsynΔgdpP were grown in the presence of 32P-labeled H3PO4, and the stringent response was induced by the addition of mupirocin. The production of pppGpp and ppGpp was monitored by TLC, and radiolabeled GTP, pppGpp, and ppGpp (produced in vitro) were run in parallel to identify the relevant spots. B, quantification of intracellular (p)ppGpp levels. The radioactive spots corresponding to pppGpp and ppGpp from Fig. 7A were quantified using ImageQuantTL, and the data were plotted with GraphPad Prism. Average values and standard deviations from three independent experiments are shown. C, strains HG001, HG001ΔgdpP, HG001relPsynΔgdpP, and HG001relQsynΔgdpP were grown in the presence of 32P-labeled H3PO4, and the stringent response was induced as described in A. The production of pppGpp and ppGpp was monitored by TLC, and the radioactive spots were quantified using ImageQuantTL. Average values and standard deviations from three independent experiments are shown.
