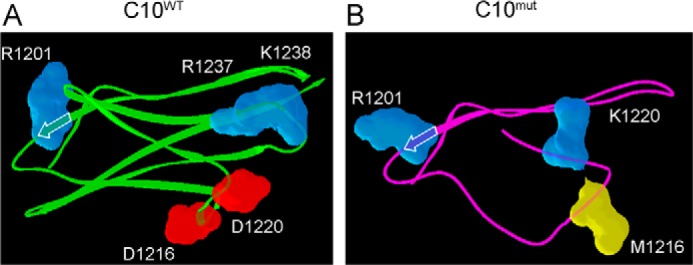
FIGURE 9.

Homology models of C10WT and C10mut domains. The top scoring homology models were selected as representative structures for the C10 domains. β-Sheets are indicated by arrows. LMM-binding residues in C10WT (A) are labeled. The corresponding amino acids in C10mut (B) are labeled.
